I began my PhD in 2014, and my advisor’s “home” conference was the ACM International Conference on Mobile Human-Computer Interaction (MobileHCI). In 2024, I marked ten years of submitting to MobileHCI annually, missing attendance only once during that time. Over the years, I have grown alongside this community, and I hope my contributions have helped shape it. I often find myself reflecting on what truly defines MobileHCI today. With the conference name change, the conference leaders also saw a change in topics. They reflected this in the name change from “Conference on Human-Computer Interaction with Mobile Devices & Services” to “Conference on Mobile Human-Computer Interaction,” reducing the emphasis, which was much more “Mobile Devices” when I started submitting to MobileHCI. In my role as a MobileHCI Co-Paper Chair in 2025, I am interested in investigating who our community is, who is publishing, where papers come from, and, to some extent, what has changed over the years. I will only consider archival publications in the ACM Digital Library (ACM DL), namely full and short papers and journal articles, which were first published in the ACM DL in 2005. Thus, this analysis covers 20 years of MobileHCI Contributions.
Note: This post is based on the data available in the ACM DL; a lot of manual work went into cleaning the ACM DL meta-data. I open-sourced my scrips, so if you find more data-clearing opportunities, please send a pull request to https://github.com/sven-mayer/mobilehci-statistics/.
Accepted Papers
Before delving into the demographic trends and topical focus, let us first examine how many papers have been published at MobileHCI over the last 20 years (see Figure 1). While the number of publications peaked between 2011 and 2016, recent years indicate a slight downward trend. A linear trend line (-0.32x + 50.97) confirms a modest decline, with an average decrease of 0.32 papers per year.
What might explain this change? Several factors have contributed to shifts in publication patterns in recent years. For instance, MobileHCI 2016 removed the page limit, potentially influencing submission behavior. In 2021, the conference officially phased out the submission type “shorter papers,” a process that had been ongoing for years; how reviewers took this into consideration is unclear, but it seems that papers with smaller contributions are not likely to be published. Starting with MobileHCI 2022, the papers track transitioned to PACM HCI, representing a significant procedural shift. Furthermore, the COVID-19 pandemic disrupted research activities in many labs, particularly in its most restrictive periods.
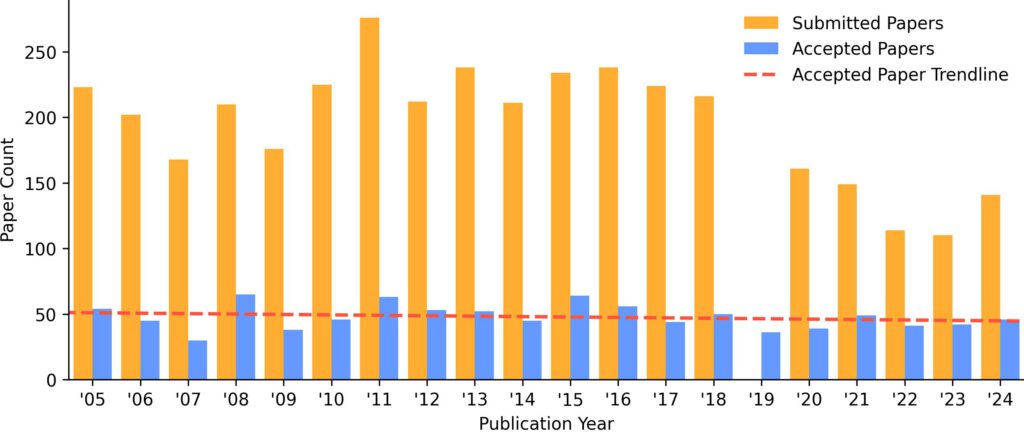
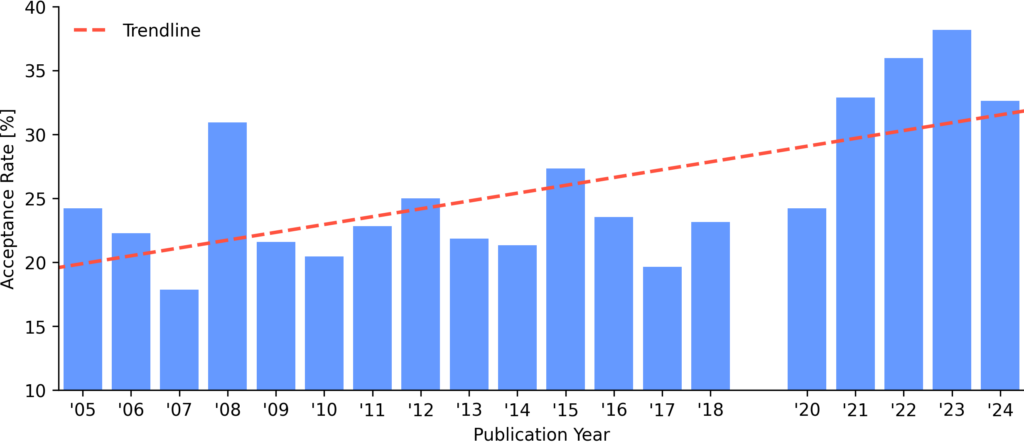
However, as we all know, the “Accepted Paper Count” in Figure 1 does not tell the whole story. To better understand the trends, it is essential to consider the acceptance rate. Figure 2 illustrates the acceptance rate over the years alongside a corresponding trend line. The acceptance rate fluctuates between 18.8% and 38.1%, but a noticeable upward trend has emerged in recent years. This increase may be linked to the Revise & Resubmit model adopted by MobileHCI in 2022. Additionally, maintaining a single-track, three-day conference necessitates the acceptance of a certain number of papers. With fewer submissions in recent years, the higher acceptance rate may reflect this balance, though the precise cause remains unclear.
Until 2022, MobileHCI operated solely as a conference without a journal track, requiring at least one author to attend and present the paper in person. Before the COVID-19 pandemic, remote presentations were generally not an option, making the conference location a significant financial factor for prospective authors. Traveling to distant locations posed financial challenges. At the same time, the community has continually aimed to be more inclusive. While the conference has primarily taken place in Europe, efforts to rotate locations globally reflect a commitment to outreach and fostering MobileHCI research worldwide. This approach not only promotes inclusivity but also helps distribute the financial burden across institutions that regularly contribute to the conference. The decision to host MobileHCI in different locations each year serves multiple purposes, but my focus is not on evaluating whether this is a positive or negative practice. Instead, I am interested in exploring whether and how these location shifts impact the nature and distribution of accepted papers.

An analysis of paper submissions by region (as defined by UN M49) reveals a slight trend favoring Europe. The average number of submitted papers per region is as follows: Europe (205), America (179), Asia (168), and Oceania (141). However, this trend is based on limited evidence, as MobileHCI has only been held outside of Europe six times in the past 20 years — in Singapore (2007), San Francisco (2012), Toronto (2014), Taipei (2019), Vancouver (2022), and Melbourne (2024). As a result, it remains difficult to determine whether the conference location significantly influences submission numbers.
Contributing Countries
To better understand who submits to MobileHCI, I will analyze the countries of origin for accepted papers. While analyzing submitters’ affiliations would provide greater accuracy, this data is not publicly available. Therefore, I will center this analysis on accepted papers. The hypothesis is that when the conference is held in a specific location, it attracts more submissions from that region due to financial advantages for local authors. Consequently, more papers from that region may be accepted. I also anticipate that this pattern extends to conference attendees, with a higher number of local participants compared to typical attendance from that location. However, exploring attendee demographics falls outside the scope of this analysis.
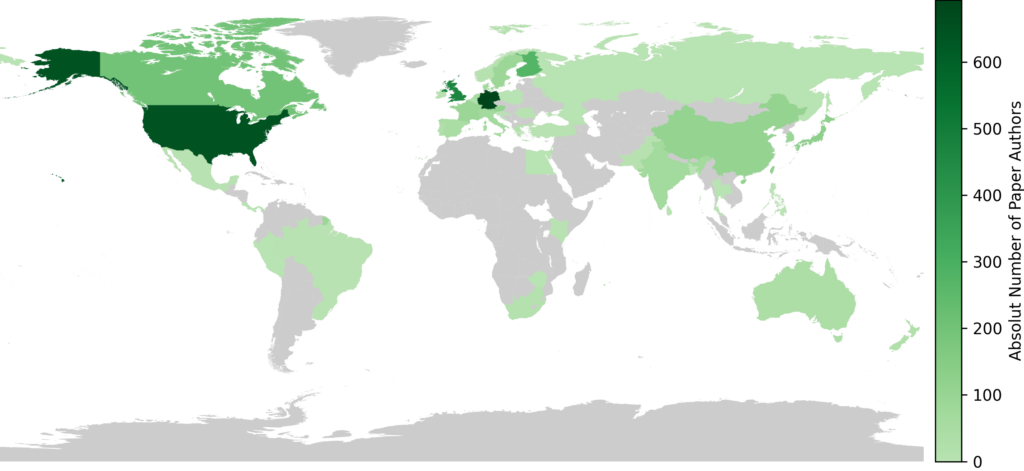
Next, we shift focus from paper count to author count. This perspective highlights the countries, affiliations, and individuals that have contributed most to the conference. Figure 4 provides an initial overview of where the authors are based, i.e., where their first affiliated institution is located. However, the countries contributing the most to the conference may not directly align with the absolute number of authors listed in published papers.
Relying solely on author count can introduce bias if certain countries consistently produce papers with more co-authors. In such cases, countries with larger teams may appear more influential, even if their total paper output is similar to others. A Kruskal-Wallis H-test confirms significant differences in author counts across countries (H(32, n=680) = 51.236, p=0.013) based on papers authored by contributors from a single country (70.98% of all papers).
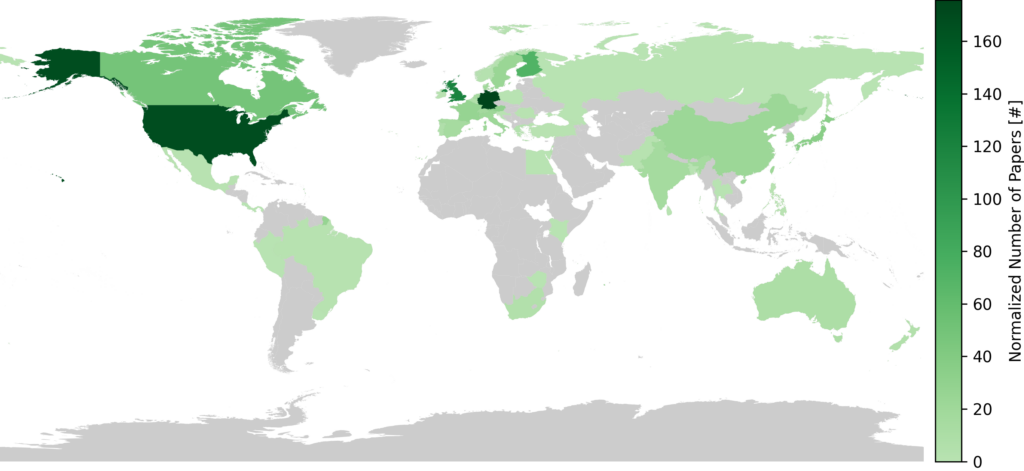
To address this, I will assign equal weight to each paper, regardless of the number of authors. Each paper’s contribution will be divided equally among all listed authors to calculate a normalized contribution. While this approach has limitations—since authors do not always contribute equally—without a structured contribution system like CRediT, further division is not feasible.
The results of this normalization are presented in Figure 5, showing minimal visual differences from Figure 4.
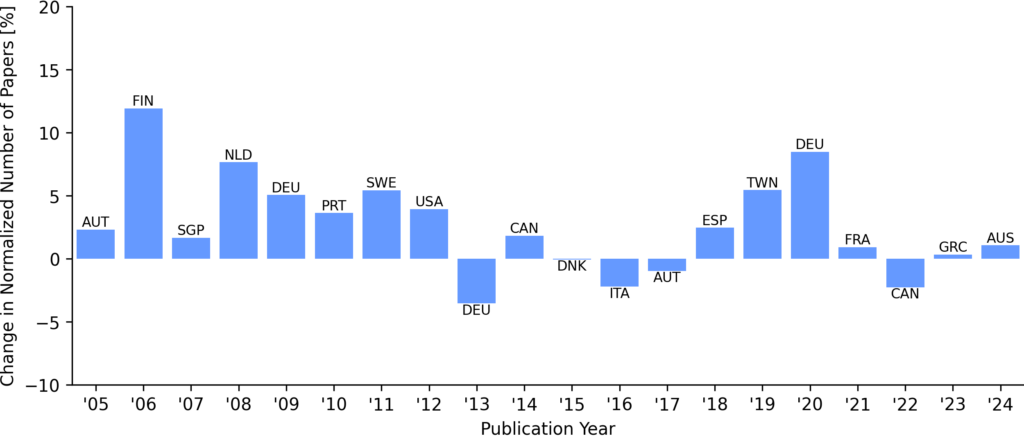
With this, we return to the question of how the conference location influences authorship and whether it positively impacts contributions from the same region. Figure 6 highlights a positive trend, suggesting that the conference location correlates with an increase in local authorship.
A Wilcoxon signed-rank test revealed a significant difference between the average number of accepted authors over the past 20 years and the number of accepted authors when the conference was held in their region (W = 34.0, p = 0.006). This confirms that location does influence authorship. However, whether this effect persists long-term or fosters the growth of new communities and regions remains an open question.
To provide further context, I next examine the countries that frequently contribute to MobileHCI, offering insight into recurring contributors. Additionally, Figure 7 presents an animation that visualizes authorship trends over the past 20 years.
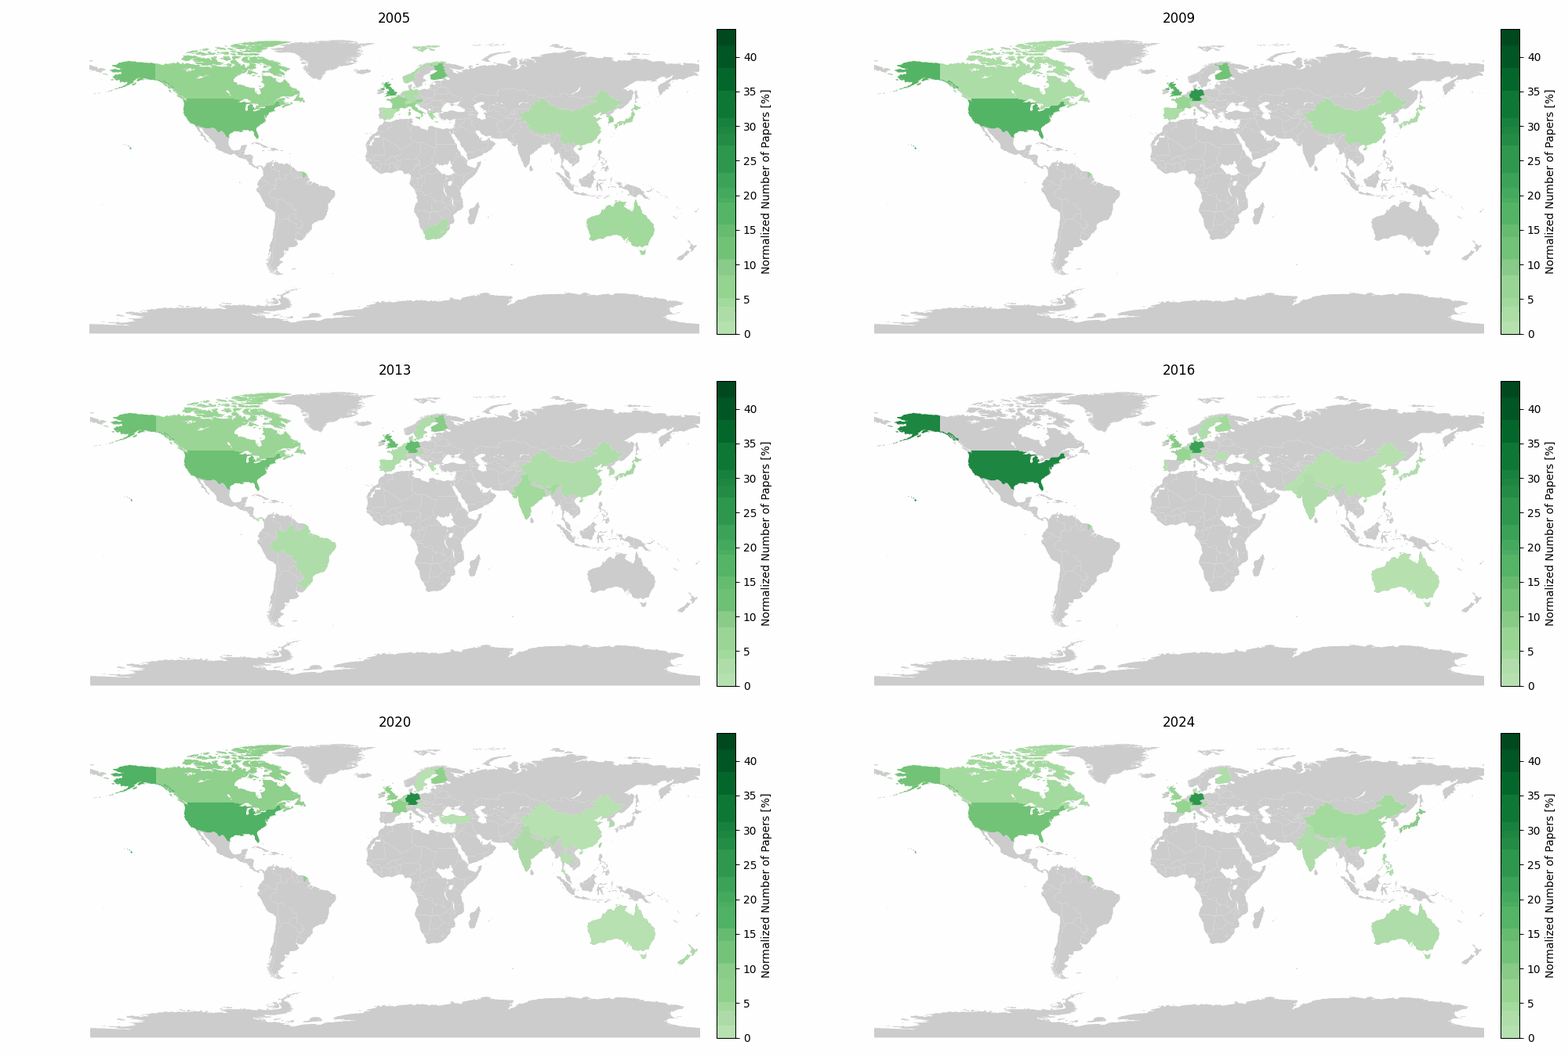
Figures 4 and 6 reveal a consistent trend, emphasizing MobileHCI’s strong European focus. The United States of America also stands out, which is unsurprising given population differences—its population is only about 25% smaller than that of the European Union.
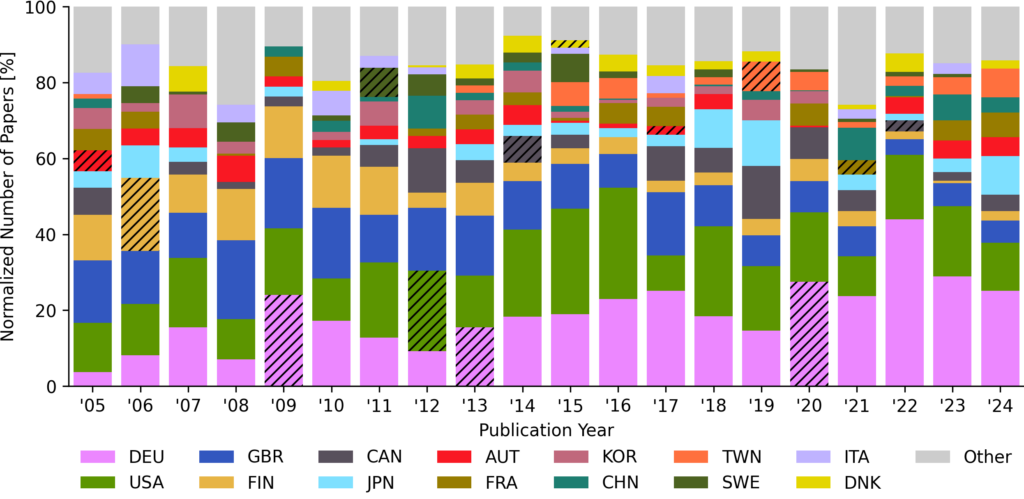
This trend is even more evident in Figure 8, which shows that Germany (DEU) has contributed the most papers over the years. Germany is followed by the United States (USA), the United Kingdom (GBR), Finland (FIN), and Canada (CAN), which ranks fifth.
Contributing Affiliations
Next, I aim to identify the affiliations that consistently contribute to the conference. To achieve this, I standardized the affiliation names by consolidating subsidiaries under their parent companies. While this manual cleaning process may introduce minor inaccuracies, the overall results remain reliable. I welcome contributions or corrections through pull requests on GitHub.
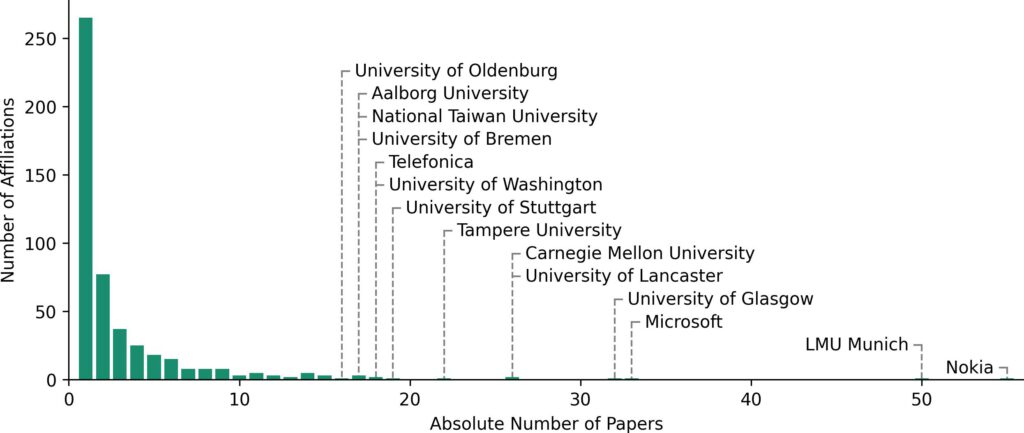
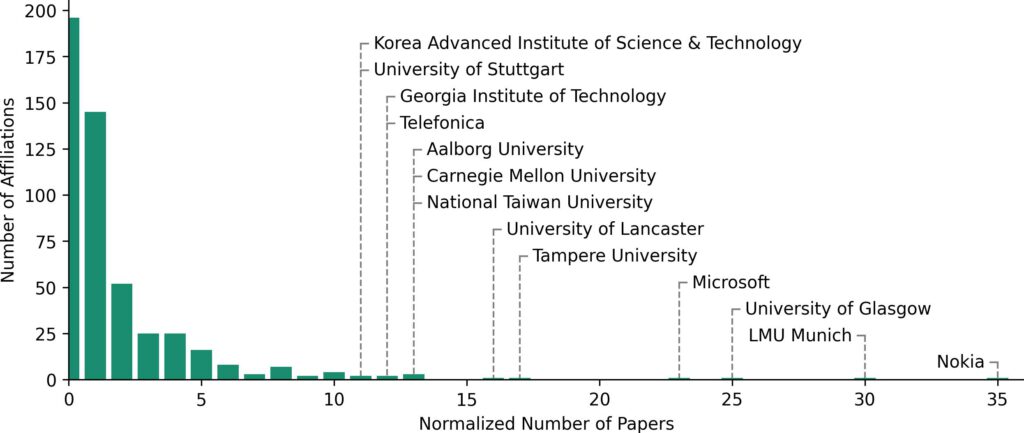
After cleaning, a total of 496 unique affiliations contributed to the conference. Notably, 265 affiliations (53.43%) contributed to only one paper. On average, each affiliation contributed to 3.29 papers (SD = 5.21). Figure 9 provides a comprehensive overview of absolute paper counts per affiliation. A total of 14 affiliations (Highlighted in Figure 9) have contributed to more than 15 papers each. Collectively, they contributed to 332 papers. Notably, these 14 leading affiliations account for 34.66% of all papers published at MobileHCI, underscoring their significant influence on the conference’s research output.
In line with the non-normalized author data by country, this distribution is expected, as the absolute count increases whenever at least one author from a given affiliation is listed. Based on this metric, Nokia ranks first with contributions to 55 individual papers, followed by LMU Munich with 50 papers, and Microsoft with 33 papers. Affiliations contributing to more than 15 papers are highlighted in Figure 9.
The absolute paper count tends to favor affiliations with many contributing authors, even if their individual contributions are minimal. To account for this, we apply normalized contributions, ensuring that each affiliation receives a proportional share of a paper based on the number of contributing authors. Figure 10 presents a similar distribution to Figure 9. For example, while Nokia is listed as contributing to 55 individual papers, their normalized contribution amounts to approximately 35 papers—reflecting the equivalent of ~35 papers authored exclusively by Nokia-affiliated contributors. The complete ranking of affiliations is available on GitHub (./export/affiliations.csv).
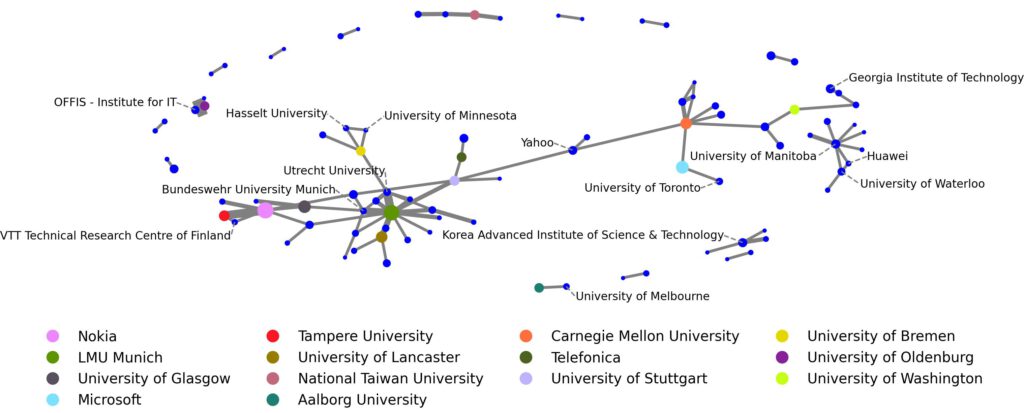
Lastly, we examine the network of collaborators. Analyzing all papers with contributions from more than one institution is not feasible (see GitHub for the complete dataset). However, focusing on collaborations that resulted in at least two papers provides an overview of the community’s collaborative dynamics (see Figure 11).
The network reveals several clusters driven by geographical proximity. For instance, OFFIS – Institute for IT frequently collaborates with the University of Oldenburg, and LMU Munich often works with Bundeswehr University Munich, both pairs located in the same city. Similarly, universities in the United States of America show strong interconnections, as do institutions in Finland, such as Nokia, the University of Tampere, and the VTT Technical Research Centre of Finland. European institutions also exhibit a tightly connected network.
However, not all collaborations align with the typical pattern of geographical proximity. For instance, the partnership between Aalborg University and the University of Melbourne suggests other influencing factors. Without deeper analysis, I speculate that such collaborations may stem from researchers relocating to advance their careers or from networking opportunities facilitated by conferences like MobileHCI – one of the key purposes of academic conferences.
Contributing Authors
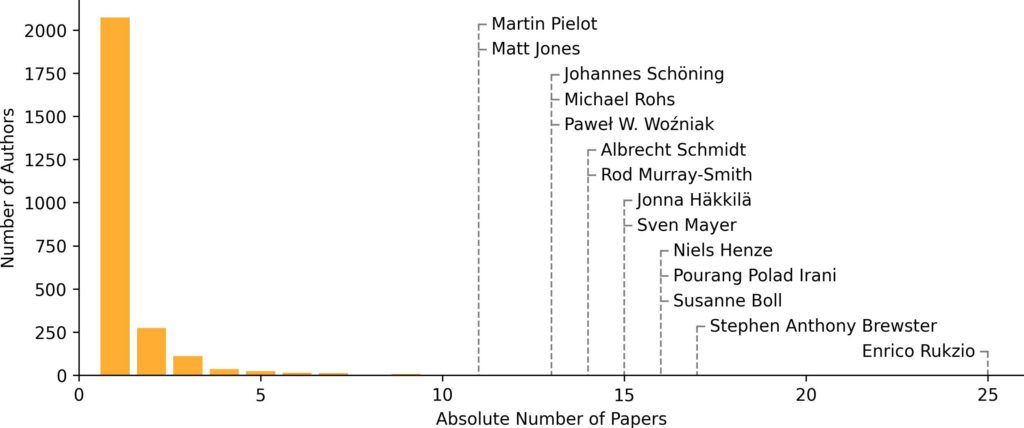
With this analysis, we have gained insights into the countries and affiliations that have contributed significantly to MobileHCI over the past 20 years. Now, we turn our attention to individual authors. As with affiliations, we assess both absolute paper counts and normalized contributions for greater accuracy. Figure 12 displays how many authors contributed how many papers.
Figure 12 highlights authors who contributed to more than 10 individual papers. Enrico Rukzio stands out as the most prolific author, contributing to 25 individual papers, making him the top MobileHCI contributor over the last two decades.
A total of 14 authors have contributed to more than 10 papers each (see Figure 12). Collectively, their contributions amount to 209 papers, of which 176 are unique. This indicates that 33 papers were co-authored by multiple top contributors. Notably, these 14 leading authors account for 18.37% of all papers published at MobileHCI, underscoring their significant influence on the conference’s research output.
Note: we can also look at these numbers on a normalized level (graphs are on GitHub), but their overall picture is similar and much harder to interpret as the true contribution to each paper is unknown.
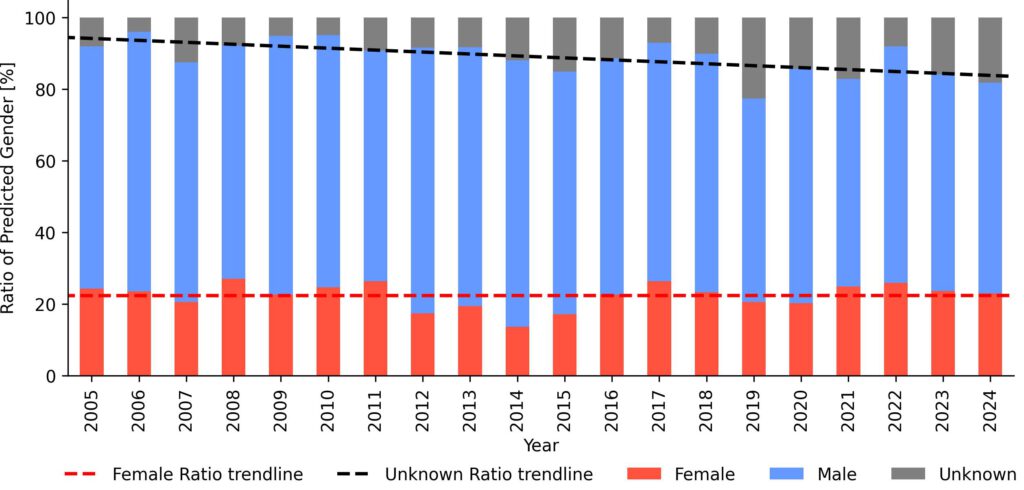
To analyze gender trends within the MobileHCI community, I used the World Gender Name Dictionary 2.0 to infer gender based on author names. The dataset classifies names as “Female” for feminine names, “Male” for masculine names, and “Unknown” for unisex or unrecognized names. While I acknowledge the limitations and inaccuracies inherent in gender and sex assumptions based on first names, I argue that the overall trends are likely in the correct direction. Figure 13 illustrates the predicted gender trend over time. Although the trend line (0.0018x + 22.348) suggests a slight increase in the percentage of female authors, the change is negligible and statistically insignificant. As such, the predicted data suggest that the female representation in MobileHCI has remained relatively stable over time. Conversely, the “Unknown” category exhibits a noticeable upward trend. Upon further examination, many names classified as “Unknown” are names used predominantly in non-native English-speaking countries. I attribute this to a bias within the dataset rather than a meaningful reflection of the MobileHCI community’s composition.
Summary
In this analysis, I looked at who makes up MobileHCI from a contributor perspective. Thus, I tried to shed light on who the base MobileHCI community is. Over the past 20 years, MobileHCI has maintained a strong European focus, with Germany leading in paper contributions. Although the conference has been held outside Europe six times, local authorship increases significantly when the conference is hosted in a specific region. One interpretation is that this is driven by financial and logistical advantages. Despite efforts to rotate locations globally, European dominance persists, raising questions about the long-term inclusivity of other regions.
At the same time, gender representation has remained relatively stable, with minimal increases in female authorship. Whether this is a MobileHCI-specific phenomenon or one that persists across the HCI community needs much more in-depth investigation.
Institutional contributions are similarly concentrated, with Nokia, LMU Munich, and Microsoft consistently ranking as top contributors. Here, the large majority of affiliations contribute only once or twice, indicating broad but shallow engagement across institutions. At the same time, 34.66% of all papers are contributed by only 14 affiliations.
On the individual level, a small group of authors drives much of the output, with Enrico Rukzio emerging as the most prolific contributor. Here, 14 authors contributed to more than 10 papers each, collectively accounting for 18.37% of all MobileHCI papers in the last 20 years.

Comments are closed.